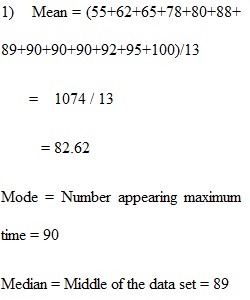
Q Please answer each of the following four (4) questions. The SPSS question is for extra credit (20 total points, with 5 points extra credit possible). 1. The following is a sample list of test scores. Calculate the mode, median, and mean, and discuss how these three scores compare to each other. (8 points) Grade 100 78 89 92 55 90 80 65 90 88 95 90 62 __________________________________________________________________________________________ 2. Calculate deviation scores for each of the sample test grades listed below. What is the sum of the deviation scores? Note: Remember that you must first calculate the mean. (6 points) Grade 100 78 89 92 55 90 80 65 88 95 __________________________________________________________________________________________ 3. Using the grades listed in question #2 above, calculate the range, variance, and standard deviation of the grade distribution. Briefly explain why it is important to square deviation scores in calculating the variance and standard deviation. (6 points) ___________________________________________________________________________________________ 4. Extra Credit SPSS Question (5 points): Using the dataset provided in the course Canvas page (under the Syllabus link), complete and answer the following: You can attach your SPSS output file or copy and paste output tables to support your answer. Using the variable “priorref" produce and fully discuss the following: 1. Frequency distribution 2. Mean, Median, and Mode 3. Skewness and Kurtosis 4. Range, Variance, and Standard Deviation 5. Histogram with Normal Curve
View Related Questions